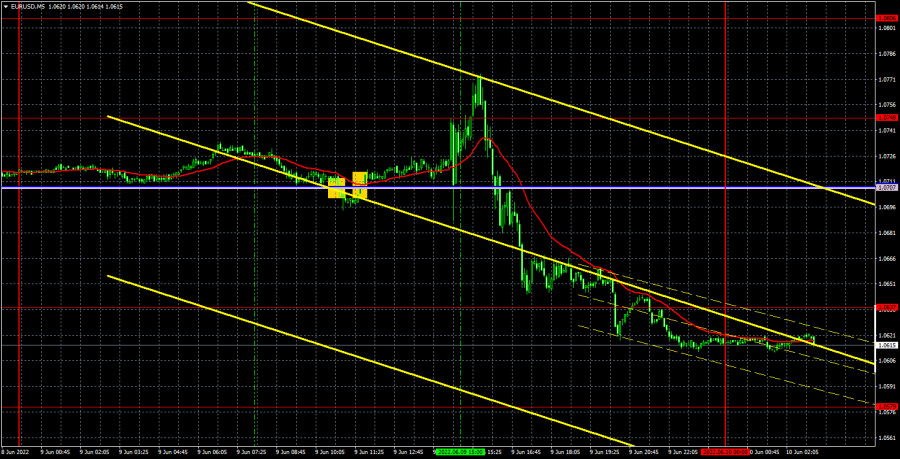
EUR/USD 5M
Yesterday, the EUR/USD pair managed to show both growth and a strong fall, and all this inside the horizontal channel. Despite the fact that the results of the European Central Bank meeting were announced on Thursday, which no one could call "passing", the euro/dollar pair has not decided on the direction of movement. At first, everything was quite logical, since the ECB signaled its readiness to raise the rate twice, as well as to complete the program of stimulating the economy starting from July 1. The euro rose to 1.0775, but then an inexplicable fall began, during which the euro lost about 130 points. Thus, according to the results of the previous day, the pair remained inside the horizontal channel, which is clearly visible in the chart of the hourly timeframe. What is the outcome of the ECB meeting? We saw strong volatility, we heard important statements, but it didn't really help the euro. The pair remains flat, even despite the high volatility on Thursday.
As for trading signals, they could not even be considered on Thursday. We noted in the chart above only the first two signals that could theoretically be considered. At first, the pair settled below the Kijun-sen and Senkou Span B lines, but this sell signal turned out to be false, and the price did not go down even 15 points, which would have been enough to set a Stop Loss to breakeven. Then the price settled above these lines, forming a buy signal, and one could earn about 30 points of profit, but it had to be closed before the announcement of the results of the ECB meeting, as there could be absolutely unpredictable movements further. As a result, traders are stuck with minimal profit. All subsequent signals should not have been worked out, since the first half hour after the announcement of the results showed that traders would trade the pair in different directions.
COT report:
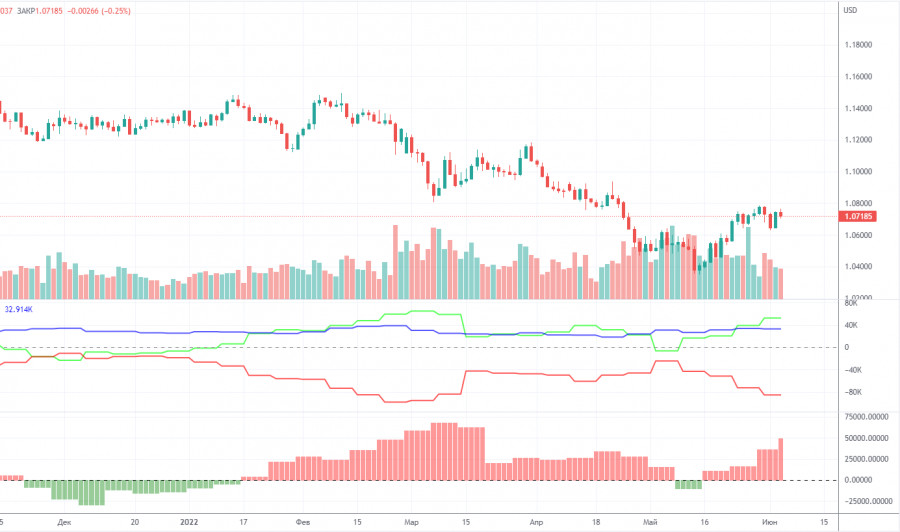
The latest Commitment of Traders (COT) reports on the euro raised a lot of questions. Recall that in the past few months, they showed a blatant bullish mood of professional players, but the euro fell all the time. Now the situation has begun to change, but not at the expense of the market players themselves, but due to the fact that the euro has begun to grow. That is, the mood of traders remains bullish (according to COT reports), and the euro began to grow due to the fact that it needs to be corrected from time to time. But at the same time, the bullish mood has persisted for quite some time, and the euro has barely managed to add 400 points in the last few weeks. During the reporting week, the number of long positions decreased by 500, and the number of shorts in the non-commercial group decreased by 13,800. Thus, the net position grew by 14,300 contracts per week. The number of longs exceeds the number of shorts for non-commercial traders by 50,000 already. From our point of view, this happens because the demand for the US dollar remains much higher than the demand for the euro. Now a certain "respite" has begun for the euro, but this does not mean that the global downward trend will not resume on Monday, and the data from COT reports will not continue to contradict the real state of things on the market. Therefore, we believe that it is still impossible to rely on such report data for forecasting.
We recommend to familiarize yourself with:
Overview of the EUR/USD pair. June 10. Expected and predictable: The ECB did not raise the rate, but gave hope to traders.
Overview of the GBP/USD pair. June 10. The central banks of the world synchronously missed inflation and are now reaping the benefits.
Forecast and trading signals for GBP/USD on June 10. Detailed analysis of the movement of the pair and trading transactions.
EUR/USD 1H
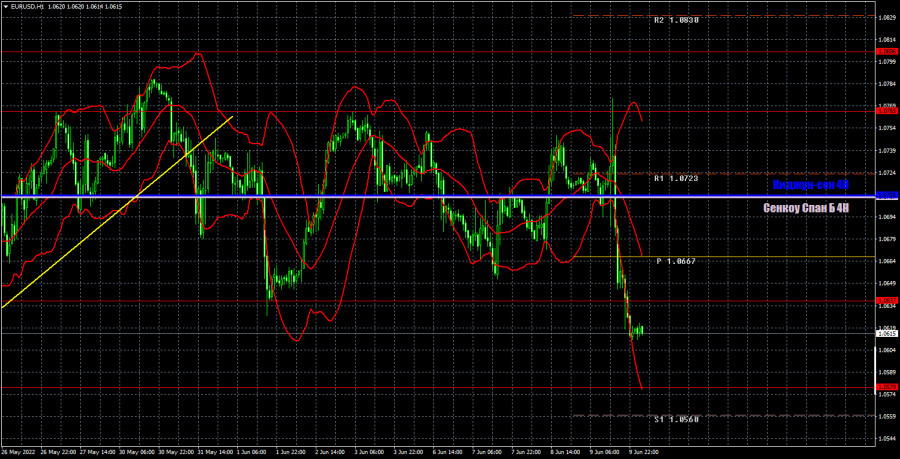
The pair is currently flat on the hourly timeframe. The fact is that neither the last local high nor the last local low can be reached or surpassed. We have already said that in the last few days the movement is most like a "swing". A "swing" occurs when traders cannot decide on the further direction of trading and provoke the formation of false signals. Be careful! Today, we allocate the following levels for trading – 1.0459, 1.0579, 1.0637, 1.0765, 1.0806, as well as the Senkou Span B (1.0707) and Kijun-sen (1.0708) lines. The lines of the Ichimoku indicator can move during the day, which should be taken into account when determining trading signals. There are also secondary support and resistance levels, but no signals are formed near them. Signals can be "bounces" and "breakthrough" levels - extremes and lines. Do not forget about placing a Stop Loss order at breakeven if the price went in the right direction of 15 points. This will protect you against possible losses if the signal turns out to be false. There are no interesting reports scheduled for today in the European Union, and a super important inflation report for May will be released in the US. However, it will become really important if its value is unexpected for the market. That is, it will not meet the forecasts.
Explanations for the chart:
Support and Resistance Levels are the levels that serve as targets when buying or selling the pair. You can place Take Profit near these levels.
Kijun-sen and Senkou Span B lines are lines of the Ichimoku indicator transferred to the hourly timeframe from the 4-hour one.
Support and resistance areas are areas from which the price has repeatedly rebounded off.
Yellow lines are trend lines, trend channels and any other technical patterns.
Indicator 1 on the COT charts is the size of the net position of each category of traders.
Indicator 2 on the COT charts is the size of the net position for the non-commercial group.